

Categories
Market UpdatesPublished August 8, 2026
Ann Arbor Market Report: July 2026

Ann Arbor home values are still climbing. What has changed is how buyers are behaving on the way there — and if you are pricing a home this fall, that difference is worth real money.
Here is what closed in the Ann Arbor Public Schools attendance area in July 2026, measured against the same month in each of the last three years. All figures come from our own MLS data, not a national estimate.
The month at a glance
- 169 homes closed, at a median price of $496,000
- Median $313 per square foot
- Median 17 days on market; 47% sold within two weeks
- Sellers netted 98.9% of asking price, and 98.3% of their original asking price
- 528 homes active and 106 under contract, which is about 3.1 months of supply — a balanced market, neither a shortage nor a glut
Four Julys, one clear trend
| July | Sales | Median price | $/sq ft | Days on market | Sold above asking |
|---|---|---|---|---|---|
| 2023 | 168 | $465,500 | $273 | 28 | 60% |
| 2024 | 159 | $519,700 | $302 | 15 | 46% |
| 2025 | 170 | $475,000 | $298 | 14 | 42% |
| 2026 | 169 | $496,000 | $313 | 17 | 30% |
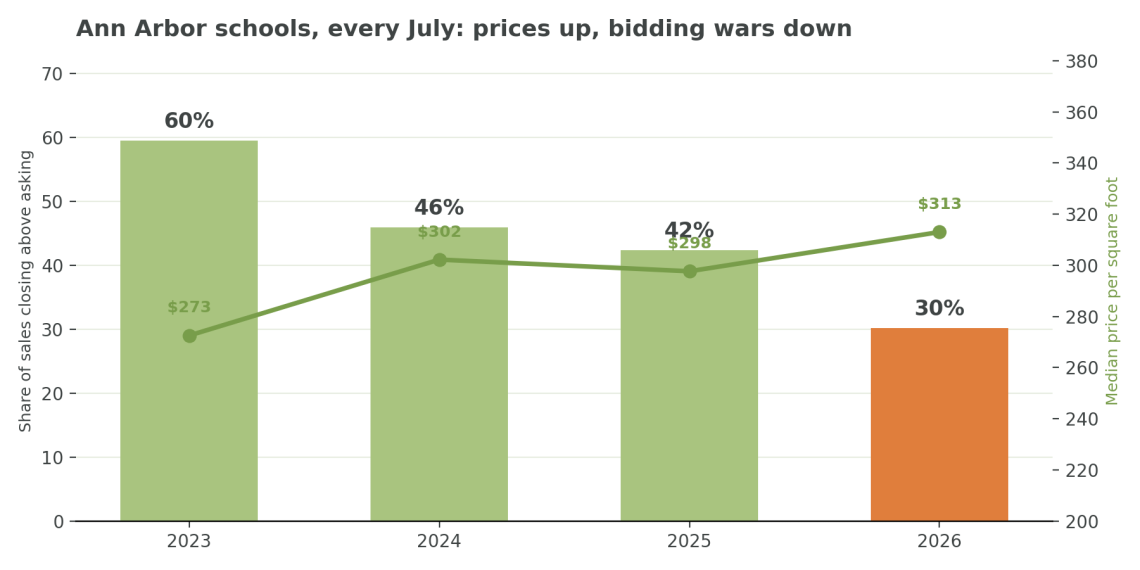
Look at the last column. In 2023, 60% of sales closed above the asking price. This July, it was 30%. Meanwhile price per square foot rose from $273 to $313 — up 15% over three years.
Both things are true at once, and that is the whole story: values are still rising, but buyers have stopped bidding blind. They are showing up informed, taking a beat, and negotiating. Sales volume, notably, has barely moved — between 159 and 170 sales every July. Buyers did not leave. They just stopped overpaying on instinct.
The most expensive mistake a seller can make
We pulled every sale from the month and split it into two groups: homes that never changed their asking price, and homes that cut it.
- Homes that never cut: sold in a median 8 days, at 100.0% of the original asking price
- Homes that cut the price: took 49 days, and still settled for 94.2%
Same market, same month. The difference between those two outcomes, on a $496,000 home, is roughly $28,614 — plus six extra weeks of showings, and mortgage payments on a house you have already mentally moved out of.
And there is a harder number behind it. The share of Ann Arbor listings that come off the market without selling and never return has climbed from 6% in 2023 to 17% last year. Those listings sat a median 71 days, and 38% of them had already tried cutting the price before giving up. Reducing late rarely rescues a listing. The first three weeks decide the outcome.
Why “new to market” is not always new
Here is something worth knowing as a buyer, and worth being honest about as a seller. When a listing does not sell, it can be cancelled and re-entered as a brand-new listing. The days-on-market counter goes back to zero, the portals treat it as a fresh arrival, and it lands in your saved-search email as if it just came up. About 45% of cancelled Ann Arbor listings come back that way, a median 40 days later.
So we checked what actually happens to those homes. Across 463 sales that failed once and returned, the home eventually sold for a median 92.2% of what it first asked, after 120 total days on the market across both attempts. Homes priced correctly on the first try sold for 100.0% of asking in 18 days.
A new listing number resets the clock buyers see. It does not reset the price the market is willing to pay. And this is becoming more common, not less: 14% of this year's sales had a failed attempt behind them, up from 3% in 2023.
If you are buying, ask how long a home has really been for sale, not what the listing says. We check the full history on any home before you write an offer — it is often the difference between paying asking and negotiating from a position of knowledge.
Houses and condos are no longer the same market
For years you could quote one Ann Arbor number and be roughly right about both. Not anymore.
- Single-family homes: 108 sales, median $560,000, $338 per square foot, 10 days on market
- Condominiums: 61 sales, median $355,000, $255 per square foot, 30 days on market
Single-family price per square foot is up. Condominium price per square foot is down 8% from last July, and condos are now taking about twice as long to sell as houses. Condominium sellers are also cutting price more often (34% of closed sales, against 24% for houses).
If you own a condominium, the practical takeaway is to price against current condominium sales in your own association or a comparable one — not against the district-wide headline, and not against what your neighbor got in 2024.
Where you are still matters
| Area | Sales | Median price | $/sq ft | Days on market | % of asking |
|---|---|---|---|---|---|
| 48104 · Central / Burns Park | 44 | $625,000 | $386 | 18 | 98.5% |
| 48103 · West A2 / Scio | 59 | $540,000 | $337 | 9 | 100.0% |
| 48197 · Ypsilanti (AAPS) | 11 | $495,000 | $217 | 17 | 100.3% |
| 48105 · North / Northeast A2 | 31 | $460,000 | $278 | 21 | 98.7% |
| 48108 · South A2 / Pittsfield | 24 | $322,500 | $244 | 18 | 97.8% |
Two areas illustrate the spread. Homes in 48103 (west Ann Arbor and Scio Township) sold in a median 9 days at 100.0% of asking — the fastest, firmest corner of the district. 48105 (north and northeast) needed 21 days and carries the most inventory. 48104 commands the highest price per square foot at $386, while 48108 remains the most accessible on price at a $322,500 median.
Price range changes the math too
| Price range | Sales | Median price | Days on market | Months of supply |
|---|---|---|---|---|
| Under $300K | 24 | $248,500 | 32 | 4.3 |
| $300K-$500K | 61 | $395,000 | 17 | 2.7 |
| $500K-$750K | 47 | $587,500 | 20 | 3.0 |
| $750K-$1M | 21 | $800,000 | 9 | 2.3 |
| $1M+ | 16 | $1,420,000 | 10 | 4.6 |
The 2.3 months of supply between $750,000 and $1 million is the tightest band in the district; homes there closed at 100.3% of asking in a median 9 days. Both ends of the market are slower: 4.6 months above $1 million and 4.3 months under $300,000.
What this means for you
If you are selling
Price it correctly the first week. 41% of the homes currently for sale in the district have already reduced their price, by a median 4.5% — and those reductions are mostly not working. Relisting later, as the numbers above show, costs more than it recovers. Get the comparable sales right, in your own price range and your own property type, and let the first fourteen days do the work.
If you are buying
You have more room than buyers had three years ago. 70% of sales closed at or below asking price this July, and 169 of the homes currently listed have been available more than sixty days. Inspection contingencies and negotiated repairs are realistic again. Homes that have been sitting are where the leverage is — especially condominiums.
If you are just watching
Values in the Ann Arbor school district are holding and slowly rising. What has normalized is the process, not the price.
Want your own numbers?
District-wide medians are a starting point, never an answer. The right price for your home depends on your street, your price range, your property type, and the condition of the three closest comparable sales. That is a conversation, and we are glad to have it with no obligation.
Call 734-302-3011, or reach out here, and we will put together an honest assessment of what your home would do in this market.
Data source: Trillium Real Estate analysis of MLS residential listings and sales in Ann Arbor Public Schools attendance areas, pulled 2026-08-07, covering 7,810 records since January 2023. Months of supply reflects current inventory against sales in the reporting month. Statistics are provided for informational purposes and are not an appraisal or a guarantee of value. Equal Housing Opportunity.

Sandi Smith
President & Broker | Sandi Smith | Trillium Real Estate
or another way